
Simple Excel Forecasting Template For Veterinary Clinics

While this excel forecasting template may be for a vet clinic, it can be edited to fit many types of businesses. Let’s go through a quick breakdown of the different sections it contains.
On the data tab of the workbook, we have a list of the types of services offered by this veterinary clinic and the fees it charges its customers. If your service fee is not a set rate, you can calculate an average charge by summing all the income from that service over the past year and dividing by the number of customers that received that service over the last year.
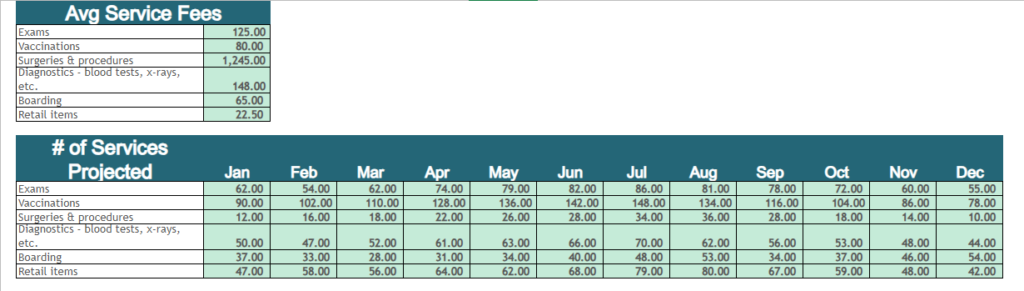
If you offer less or more services than those listed, or prefer different names for them, you can edit, add, or delete whatever you need to.
The number of services projected section will come from demand forecasting. Read this article to gain an understanding of the forecasting process.
The expected costs section of the data sheet is a forecast of all of your costs. You may have more or less expenses than this or prefer different names. Once again, change, add, or delete any lines that you need to.
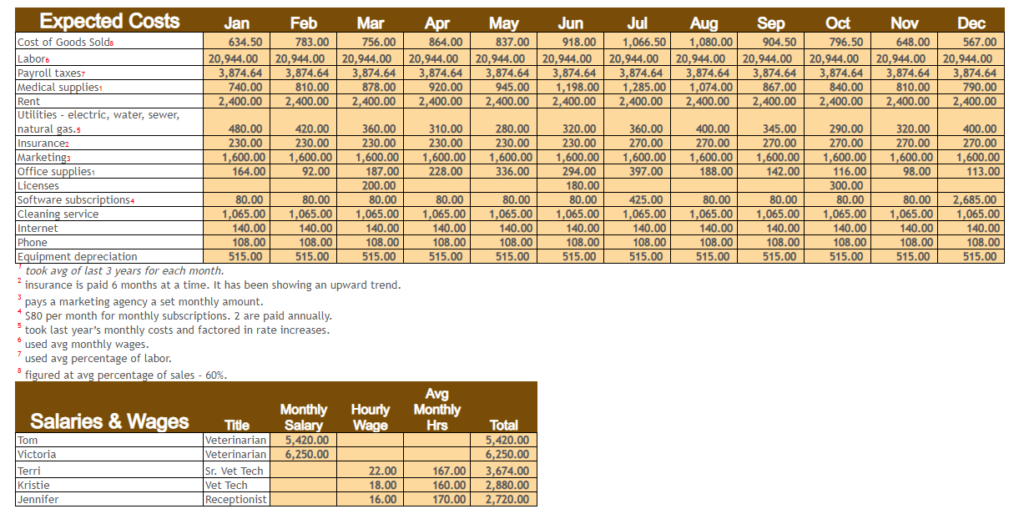
If the cost tends to be fixed or the same amount each month, then simply copy and paste that amount to each month. If the cost tends to be variable or changes depending of sales level or other factors, then you can calculate an average from last year’s income statement or you can see what percentage of sales it historically represents and multiply that percentage by each forecasted month’s revenue.
Since labor is the clinic’s largest cost, it warrants a separate table. Fill in the names and wages, or salaries, of all of your employees. You can go ahead and do an average salary and average number of hours each month for your hourly workers based on the previous year’s payouts. Monthly salaries and hours will of course be a little different depending on how many pay periods fall in a month, but we use the average total to keep things simple. If you know that some months are always higher or lower when it comes to payroll, you can figure different totals for different months.
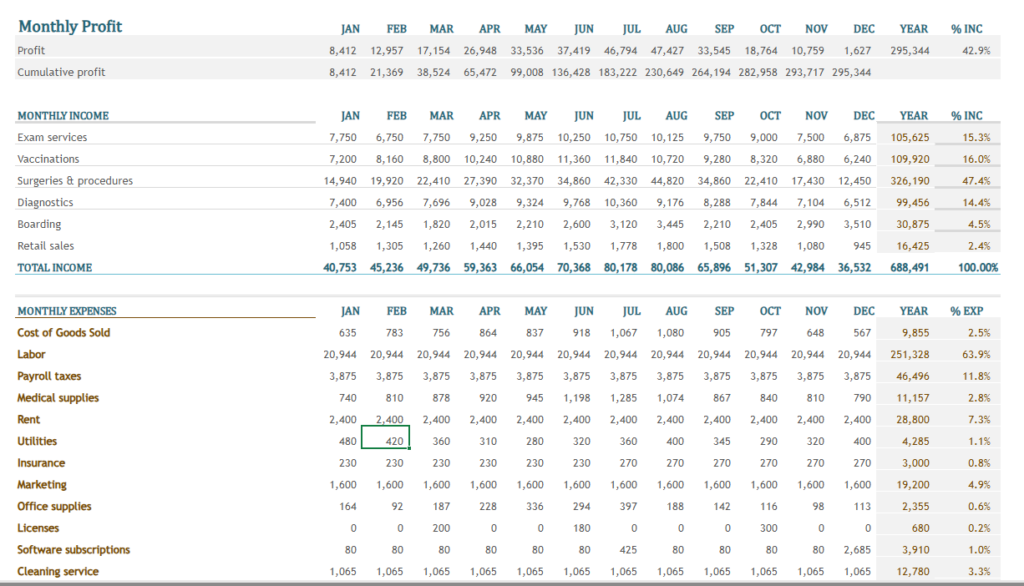
The yearly forecast tab pulls the numbers from the data tab into the monthly income and monthly expenses sections. The monthly profit rows are formula driven, simply subtracting costs from sales each month and keeping an cumulative total.
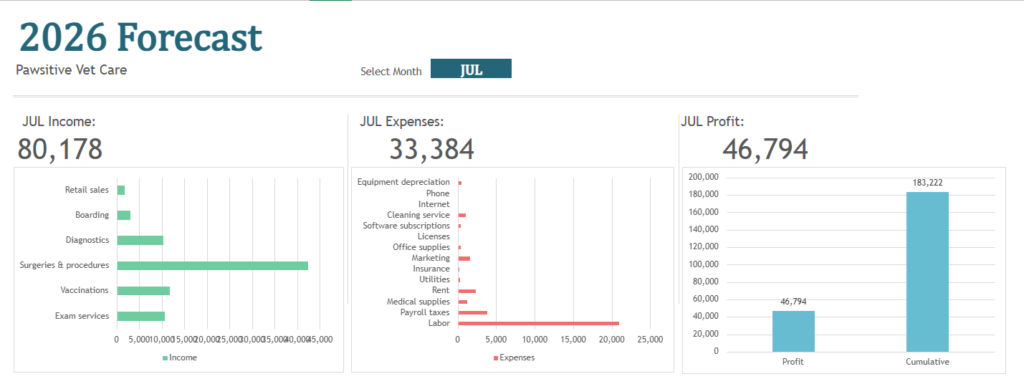
The charts and totals at the top are based on the month you select from the dropdown field above the chart section. The data for the charts comes directly from the dynamic table tab. You will need to change the income category and expense category names in the dynamic table to reflect what you have on the data tab. The numerical columns are formula driven. The month column reflects whichever month you choose to see on the yearly forecast tab.
Here is the entire excel template to download. If you find that you are having trouble with your forecasting or would like to explore a more robust model, reach out to us here.


[…] you would like a free simple excel forecasting template, you can find it here. It’s a good starter template for a small business. As you become more comfortable with […]