Forecast and Pro-Forma Financial Statements
Here we have a forecast model for a sales and service company. We start by collecting prior years’ data for the various accounts that make up the general ledger. As the top line of the Income Statement, revenue has to be forecasted first, and accurately, before the rest of the accounts can be projected. This is done by testing methods, like regression analysis, ARIMA, and Holt Winter’s method, against previous periods to determine the best fit. The one with the lowest error percentage wins.
Determining fixed and variable costs comes next, followed by building forecast schedules for each. Schedules for Balance Sheet accounts have to be built as well. And once we have a pro-forma P&L and Balance Sheet, everything has to be converted to cash basis to put together the Cash Flow Statement. You will notice the large number of sheets required in this workbook. If it looks like a lot of work, that’s because it is. Building a good forecast model, comparing it against actual results each period, and adjusting it accordingly are some of the most complicated and time consuming financial planning and analysis tasks there are. But also some of the most valuable.
Financing Requirements
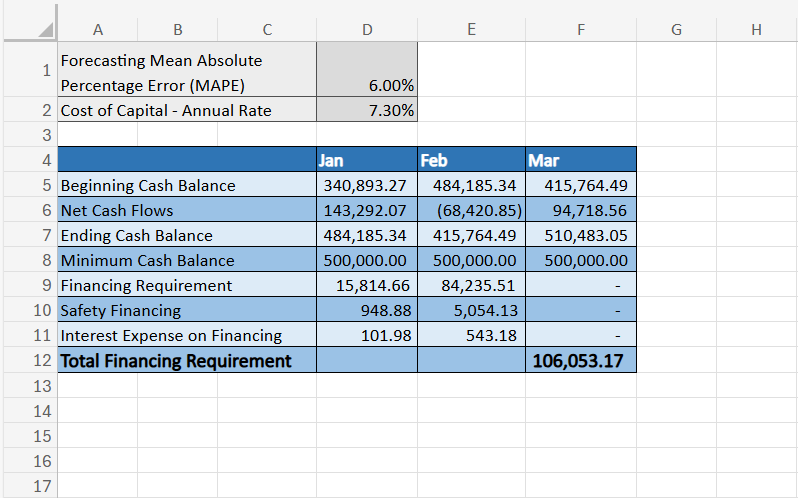
One of the most important reasons for forecasting is to see if the company will have enough money to operate on or will need some form of financing, whether that be a bank loan, owner financing, selling equity shares of the business, or so on. Here we find out what the cash needs are the coming quarter for a company based on forecasted cash inflows and outflows, and a minimum cash balance that the business desires.
It’s not quite as straight forward as subtracting the projected ending cash balance from the minimum or target balance, however. Because forecasts are subject to error, we have to look at what the average error percentage is when comparing actual results to forecasts in the past and use that to adjust our needed amount upwards in case our estimate is too low.
Variance Analysis
Variance analysis follows the budgeting or forecasting process. It compares the prediction or goals to the actual data. It’s a chance to delve into why things went differently than expected. Static budgets/forecasts stay the same throughout the year and don’t get revised, while rolling budgets and forecasts are updated each period to try to reflect real performance more closely. The longer out you try to forecast and the fewer times you adjust it, the more inaccurate it becomes, and thus the less useful it becomes for planning. That’s why doing frequent variance analyses and forecast updates are so important.
Trend Analysis
Trend analysis shows a company what direction its financials are headed and digs into the reasons why it might be occurring. This allows a business to spot strengths and weaknesses, manage risks, take corrective action, identify opportunities, and make strategic decisions. Here we have a trend analysis report for a real estate company involved in both rentals and property sales.
Debt Analysis
Having a large amount of debt isn’t always a bad thing for some types of businesses, as debt can be necessary for growth. But it’s something that has to be watched closely or else the business could face insolvency. Here we have a report for an equipment rental company that shows how close its debt ratios come to targets that we’ve set, and what the results ultimately mean for the health of the company.
Asset/Inventory Analysis
Following the equipment rental example above, the company also needs to know how its equipment inventory is performing. Here we show revenue and relevant costs for each class of equipment to see which ones are making the most profit and which are not. It’s important to have this kind of granularity in your reporting for strategic decision making on which assets should be disposed of and which are strong contenders for future investment.
Service Business KPI’s
Sometimes businesses want to keep an eye on more than just the finances. Here we have a customized dashboard for a landscaping and lawncare company that displays customer related KPI’s and work efficiency analysis alongside financial metrics.