How to Forecast Your Company’s Earnings

Table of Contents
Introduction
We should get one thing out of the way before jumping into how to forecast. The terms budget and forecast are often used interchangeably, but in reality they are two separate things. Budgets are goal setting and control devices. You can use them to set sales targets and expense limits. At the end of each period, you compare your actual results to your budget and investigate the variances to see what went wrong. You then put a strategy together to control costs and hit income targets more effectively going forward.
A forecast, on the other hand, is used in financial planning. It’s a prediction of what you believe your company’s performance will be in a future period based on past performance. Other than historical data, you can also consider qualitative factors that might influence results, like an increase in competition within your industry in your local area or an increase in negative customer ratings that could keep people away.
Why Forecast?
Forecasts are valuable for businesses that are looking to grow or that like to plan ahead for other strategic goals. For example, if you want to know if your business should use its current reserves of cash to invest in new equipment, open a new location, or hire more employees, you would need an accurate forecast to tell you how much of your reserves would be safe to use based on predicted operating cash flows for the coming period. In other words, a forecast tells you if operating cash flow will be high enough in the future that you don’t need to hang on to all of your savings.
Forecasts can also help you plan for financing needs. Let’s say that your quarterly forecast shows a seasonal slow down resulting in a net loss and negative cash flow, and you don’t expect to have enough in your operating account to cover the losses. The company might need to seek a line of credit or a short-term loan that can get them through the period. Planning ahead by using forecasts can allow your company to be prepared for rough patches.
If your business depends on inventory, forecasts can help you avoid overstocking or understocking by accurately predicting demand, which can lead to cost savings, improved availability of items, and reduced lead times.
If you operate a production based business like manufacturing or construction, forecasting can help you optimize your production plans and help your business run more efficiently by helping you determine man hours needed, materials required, overhead costs, and so on.
Forecasts can help highlight market changes and trends, which allows a company to identify new opportunities and potential risks. If, for instance, you notice that demand is declining for one of your core services, it might be time to diversify by looking at other revenue streams.
Forecasts can aid in resource allocation. If you see that one of you locations is losing popularity to the point of being unprofitable, you could choose to invest in a marketing plan to turn it around or choose to close it and put the funds allocated to it towards other profitable locations.
Through what if scenario forecasting, you can put together contingency plans for different courses of action or for different levels of performance. For example, you could do three forecasts: a best case scenario in which profit continues rising, a middle case where the company maintains its current earnings, and a worst case scenario in which an economic downturn happens and the company begins losing money. For each, the company could then put together a plan on how to handle each scenario.
Quantitative vs Qualitative Forecasting
Quantitative simply means based on numerical data. Qualitative means based on non-numerical factors, like the condition, quality, type, or description of something. If you say the red car has 100,000 miles on it, the mileage is a quantitative factor; the color red is a qualitative factor.
Forecasting methods can be broadly divided into quantitative and qualitative techniques. Qualitative forecasting techniques involve someone’s judgement. The judgement may be somewhat based on past quantitative data, but it relies heavily on intuition. A good example of this would be if you asked your sales account managers to come up with a sales forecast for each territory. Numbers from the past year show that income from one of the west territory’s biggest customers has been steadily close to $40,000 a month. But the west account manager has recently found out that the customer hired a new purchasing manager for its biggest production facility, who is rumored to be in talks with other suppliers.
Since it looks like the facility may not be buying as much from them anymore, the account manager predicts that the customer’s overall material orders will decrease significantly. He ends up estimating that income from them will decrease by at least 35%, making his forecast for that customer $26,000 a month. That estimate is a judgement call. He may be completely right or he could be entirely wrong.
Quantitative forecasting uses historical numbers. It’s based on the presumption that past performance is the best predictor of future performance. There are several different quantitative methods that we will discuss in another section. While they are based on real data and past trends, and some are sophisticated and complicated to calculate, they are not guaranteed to be more accurate than qualitative methods. Because they fail to take into account qualitative factors like industry conditions and national economic slowdowns, they can be wildly inaccurate in certain situations.
Therefore, there is no perfect forecasting method. There are some studies online which suggest that a quantitative method in conjunction with qualitative factors is more accurate than any stand alone technique.
Who Forecasts?
Some companies make their finance or accounting department solely responsible for forecasts. In some, only top level managers do it. For others, it’s more collaborative. The sales department may come up with income figures. Production planners may come up with material requirements. Purchasing may put together costs based on production plans. And finally accounting may come up with general and administrative expenses and put it all together into pro forma financial statements.
In the end, executives or owners usually review the forecast and make revisions, if necessary, before approving it.
For smaller businesses or those without the internal expertise to create a forecast, there are services that specialize in financial analysis, such as AccountAlytix, that can do it for you.
Statistical Methods
Statistical forecasting involves predicting future values of a time series by analyzing historical data patterns. There are several well known statistical forecasting methods, including naive forecasting, growth percentage, moving average, exponential smoothing, regression analysis, Holt Winters method, ARIMA, SARIMA, and TBATS. There are also countless numbers of custom methods that people and organizations come up with.
Forecasting financials is a top down process. You start with income and work your way down to expenses. Many balance sheet accounts will be based off your forecasted profit and loss statement. And your forecasted cash flow will be based off a combination of your P&L and balance sheet.
You can either forecast sales directly or indirectly. Directly means you would use past sales totals in dollars for statistical method inputs. Indirectly means you first forecast demand and then calculate dollar totals based on demand. For instance, if you have a service business, you could use the number of jobs, customers, or hours you had for each type of service over the last year or more to predict the number you expect to have going forward. You could then take the forecasted number and multiply it by the rate you charge for each service.
The method you choose to use should be based on the shape of your historical data. Create a line chart in a program like Excel based on the last one to three years worth of sales or demand figures. Though the following examples are just a small sample of what chart shapes are possible, they should give you an idea of how to evaluate yours.
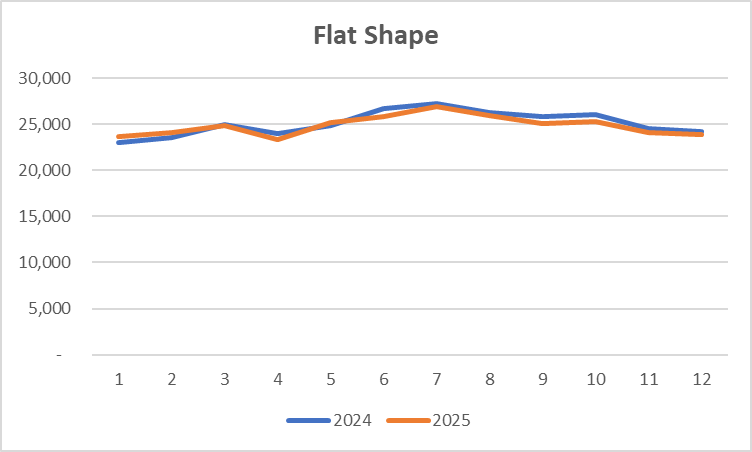
The data you see below is fairly flat and fairly consistent. The monthly totals only vary between about 23,000 and 27,000. So, there aren’t any drastic peaks or valleys. You see also that 2025 follows 2024 closely. The lines overlap at multiple points and they go up on the same months and down on the same months almost identically.
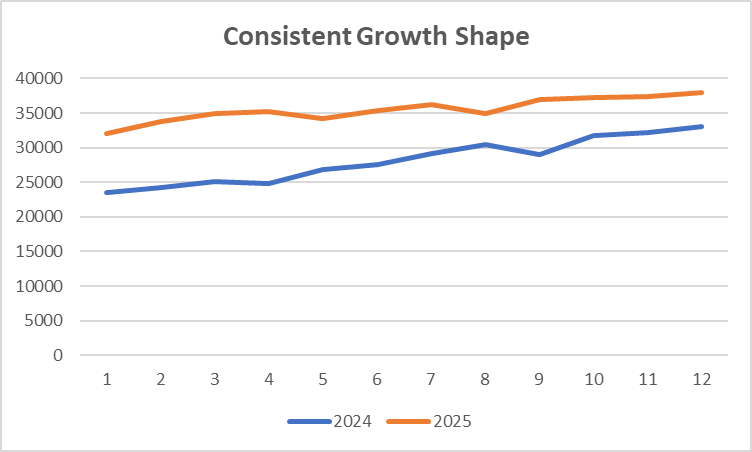
This next chart shows a consistent upward trend each month and each year. There are some months that dip ever so slightly but overall the lines are linear.
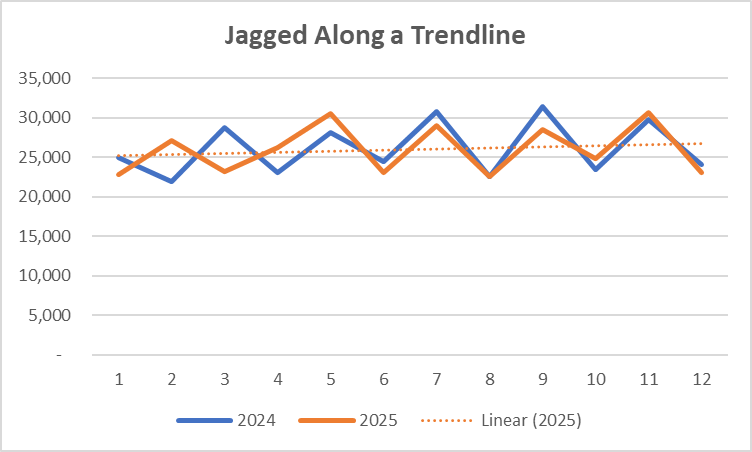
This next shape looks erratic with a lot of ups and downs but when you add a trendline to the chart you can see that the trendline is almost straight across and none of the points deviate significantly from the trendline.
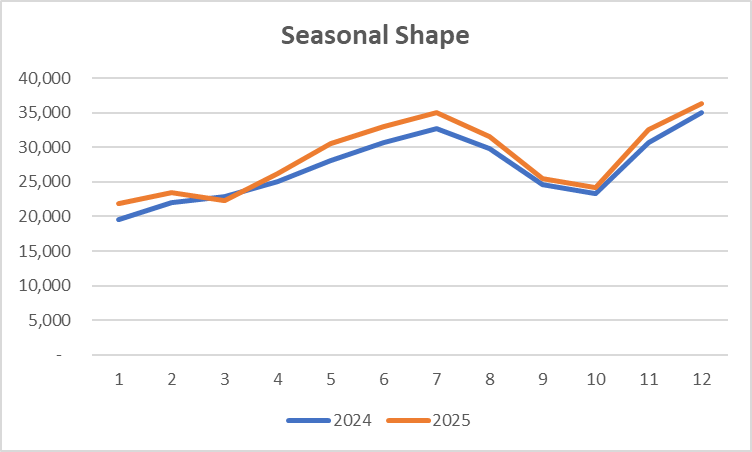
This last shape shows clear seasonal patterns. The first of the year is slow. Sales ramp up as the months get warmer and then slump again toward the fall. Then there’s another increase around the holidays.
Naive forecasting is the simplest method. You simply copy the last period’s totals to the period you are forecasting for. In other words, you are assuming that everything will stay the same or very close to it. This can work fine for companies with a stable customer base where they are charged monthly. If from year to year, you have a fairly flat shape to your data, you could consider using this, but if your income fluctuates much, it wouldn’t be a good idea.
A moving average is fairly simple to calculate, being as easy as applying the AVERAGE function in excel to a range of cells. The moving part refers to the fact that each new period will require an updated average. If you were forecasting for January, you might use the last 12 months or the prior Jan-Dec. Then when you want to forecast February, you would use the prior Feb-Jan. For March you would use the preceding Mar-Feb. And so on. This method can work well for flat or low fluctuation shapes. It can also be a good fit for jagged or irregular shapes, as long as the trendline on the chart is not heavily slanted and as long as the peaks and valleys aren’t drastic or far off of the trendline. Slants can indicate an upward or downward overall trend, which is something that a simple moving average doesn’t account for very well. It also isn’t ideal for data that shows a clear seasonal pattern.
The growth percentage method is a little more involved but still relatively easy to calculate. You simply find the average amount that your sales or demand is growing and multiply the prior month’s sales total by 1 plus the average growth percentage. As an example, if December’s sales were $152,000 and you found that the average amount of growth is 9%, you would do 152,000 * 1.09 = 165,680. This will be a moving growth average, meaning that each new period will require an updated average calculation. Growth percentage is fine for sales or demand that is consistently growing with no large fluctuations or seasonal patterns.
Exponential smoothing is a method that uses a weighted average that applies the greatest weight to the most recent data points. It involves choosing a smoothing factor, which can involve guesswork, testing, and trial and error. There are a few versions – simple exponential smoothing, double exponential smoothing, and triple exponential smoothing or Holt Winters method – each one’s formula being more complicated than the last. Double exponential smoothing is more appropriate for data showing some kind of trend. Holt Winters or triple exponential smoothing is best for data showing both a trend and a seasonal pattern. Simple exponential smoothing can be used on most other data shapes.
Explaining the calculations for these more complex methods is beyond the scope of this article, but there are resources available online if you want to learn. My advice to most business owners and managers is to find an analyst who is well versed in these techniques to save yourself a lot of headaches.
Regression analysis is good when there is a trend in your data or a strong relationship between one variable and another. In fact, when you run regression in excel, you need to input a dependent and independent variable for it to work. If, for instance, you think your marketing spend is highly correlated to your sales totals, you could use marketing as your independent variable and sales as your dependent variable. But you would need to verify the strength of the relationship, before trusting any forecasted values, by checking the p-value, r-squared, and the coefficients.
Like with exponential smoothing, there are different types of regression: simple linear regression, multiple linear regression, non-linear regression, and more. Simple regression involves only one independent variable while multiple regression involves two or more independent variables. Non-linear regression is most appropriate for curved or irregular data shapes that are hard to fit a straight trendline through.
Auto regressive integrated moving average or ARIMA is best calculated in a statistical programming language like python or R programming due to its complexity. You can use it for most data shapes, but the SARIMA version is better for data displaying seasonality.
TBATS, which stands for Trigonometric seasonality, Box-Cox transformation, ARMA errors, Trend and Seasonal components, is a robust method that’s designed to handle data with multiple seasonal patterns and non-stationary trends. Once again, it’s best to use python or R programming code to calculate it.
Finding the Best Method
Often times it’s best to try out multiple methods on your data to see which one is most accurate. To do that you forecast for a period that has already ended by using data prior to the start of that period. If you want to be able to forecast for 2026, this is what it would look like in practice: you create a forecast for 2025 using data from 2024 and 2023. You then measure your forecast accuracy by comparing the actual results from 2025 to your forecast. The method with the lowest variance would be the one to start forecasting 2026 with.
The number of data points you use when forecasting can influence accuracy as well. Depending on the trends and patterns in your data and the methods you choose to use, you might want to use lots of data points or very few. For instance, if you were trying out a moving average when your sales have shown a sharp increase in the past few months, you might find that doing a 4 month average yields better results than using the last 12 months. You might also find the exact opposite in other cases and with other techniques. Sometimes multiple years worth of data will allow a method to identify trends and patterns that a single year or less can’t provide.
You might want to try out various quantities of data points with each method and compare them to actual figures as well.
Trying out methods and data quantities in this way is known as fitting or training a model to your data. The ultimate goal is to find the one with the lowest error. There are several metrics for measuring forecast accuracy, including mean absolute error (MAE), mean absolute percentage error (MAPE), and root mean squared error (RMSE).
Fitting your model won’t make it perfect, however. Forecasting is an iterative process whereby you are continually seeking improvement. At the end of every period, you should check forecast accuracy and investigate the differences. Make adjustments to your model where necessary. The goal is to lower your forecasting errors and get your forecast as close as possible to actual results.
Unfortunately, perfection almost never happens. You will likely always have an error no matter how much tweaking you do to your model. In general, if you can get your total error percentage under 10%, you are doing very good.
Forecast Length and Accuracy
The general rule in forecasting is, the longer out the forecast is, the less accurate. If you want to forecast for an entire upcoming year, it will most likely be more error prone than forecasting for just one quarter, and forecasting for a quarter will be less reliable than forecasting for one month. The reason is because of the lag in feeding recent data to your model to train on. When you forecast for a year, there’s a 12 month lag in new data for your model to work with because you won’t be updating the model until the year is about up. Any new trends or patterns won’t be picked up on throughout the year by your model. Whereas when you forecast monthly, you can provide the model fresh data at the end of each month.
If your business requires a long range forecast, then it could choose to do a rolling forecast instead of a static forecast. A rolling forecast is one that is updated each month to reflect data from the month that just ended. It will help accuracy but it’s not a cure all. The later months are still going to be less accurate than the earlier months of the forecast. And it should also be noted that any planning you do at the start of the year could be thrown off by the ever changing totals that a rolling forecast produces.
Summary
If this all sounds complicated and time consuming to you, that’s because it is. And we haven’t even discussed the process of forecasting expenses, how to figure account balances based off your forecasted P&L, or how to create a cash flow statement from it all. Creating a forecast model can be a daunting challenge. That’s why I said earlier that finding a professional to help you is often the best course of action.
The good thing is, once a model is built, you mostly just need to update it with new data and make some adjustments here and there. The formulas in your model will take care of the hard work.
If you would like a free simple excel forecasting template, you can find it here. It’s a good starter template for a small business. As you become more comfortable with forecasting, you can add on to it and customize it to your liking.


[…] number of services projected section will come from demand forecasting. Read this article to gain an understanding of the forecasting […]